
Reporting Dashboard
The Reporting Dashboard is designed to help you measure the impact of your community outreach efforts by providing you with key post engagement metrics such as reach, shares, and upvotes per post. By clicking the “Report” tab in the navigation bar, you can now view these metrics to see how the community engages with your posts.
How It Works:
- Log In:Users can easily access the tool through their Verified Account by logging into
- View Dashboard: On the top menu, users will find a tab labeled "Report", select "Report" to view dashboard
- Select Post:Users can view a summary of the entire dashboard, or choose a specific post to analyze in more detail
- View Metrics:Once the post is selected, the tool displays comprehensive metrics, including reach, shares, upvotes, and average engagement rate
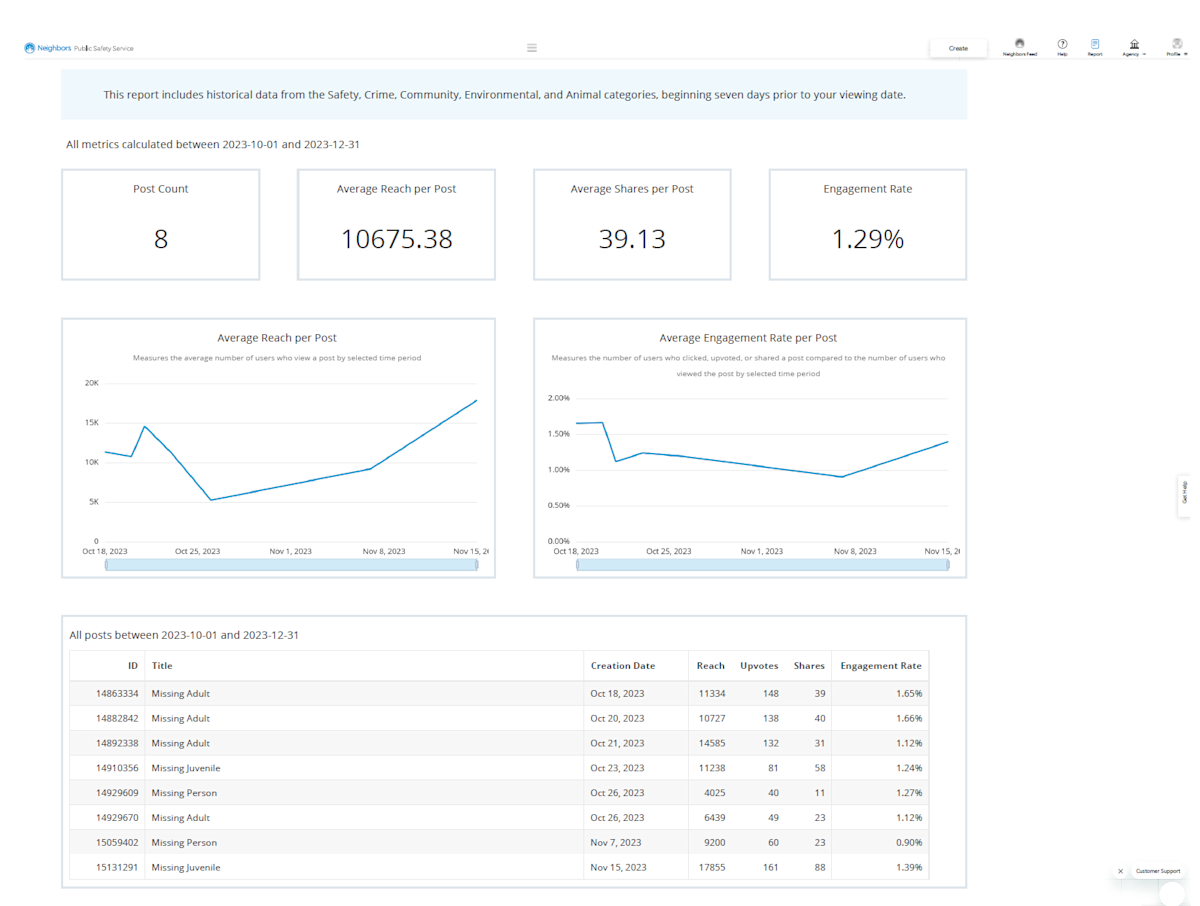
Dashboard Overview
How to download a report
- Select the desired timeframe: Choose the date range you want the report to cover.
- Locate the post table:Scroll down until you see the table containing your report data.
- Access export options:Hover your mouse over the Post Details table table. This will display three vertical dots in the top right corner.
- Choose your export format:Click on the three dots and select "Export to Excel" or "Export to CSV" to download the report in your preferred format.
Amplify Your Voice on Neighbors with These Engagement Boosters
- Establish a Steady Posting Cadence:Maintain a consistent posting schedule to keep your community informed and engaged.
- Diversify Your Content:Share a captivating mix of photos, videos, and text posts to offer a variety of content.
- Nurture Connections:Engage in productive conversations by promptly responding to comments and questions with helpful info
FAQs
When will I see my post analytics in the report?
Your post analytics will appear in the reporting tool within 7 days of publishing the post.
How far back can I go to see my post analytics?
You can view post analytics for up to one year in the past.
What is post "Reach"?
Post shares indicate the total number of times your post was shared from Neighbors to another service. This can include reposting/sharing on other social media sites or simply texting a link to a friend.
What is post "Upvotes"?
The number of users who have given a post a thumbs up.
What is post "Engagement Rate"?
Post engagement rate is calculated by dividing the total number of engagements a post has received by the total reach of that post.
What is post "Creation Date"?
The creation date is the date on which your post was published on Neighbors.
What is the post “ID”?
A post ID is a unique identifier assigned to each post on Neighbors.